Measuring atmospheric methane - science snowed under
Before we dig into the sources and sinks of the global methane
cycle, we should first know how methane is measured.
 |
| Figure 1 | NOAA's air sampling network. This network is used to measure the atmospheric composition. Most air sampling sites are on the surface (red dots), but at some places the greenhouse gas index is measured from aircrafts (blue stars) at different altitudes. In addition, there are some baseline observatories at remote locations, as Mauna Loa in Hawaii. |
How can we measure methane before this time? How can we trace back to the atmospheric composition of thousands of years ago?
Ice cores are the answer. Air bubbles are trapped in ice when snow is turned into ice under high pressure. These bubbles provide a direct glimpse into past methane levels. By, for example, counting the annual layers in the ice cores, we can retrieve the date of the air concentrations. The ice core records derived from the ice sheets of Greenland and Antarctica can bring us back as far as 123,000 and 800,000 years, respectively (fig. 2).
 |
| Figure 2 | Atmospheric methane concentrations from 800,000 years ago until now. Data is retrieved from ice at Dome C, Antartica. |
In the next video Nerilie
Abram from the British Antartic Survey tells us about the process of ice drilling and her
experience of working in Antarctica.
The concentration of methane is not the only feature ice cores can tell
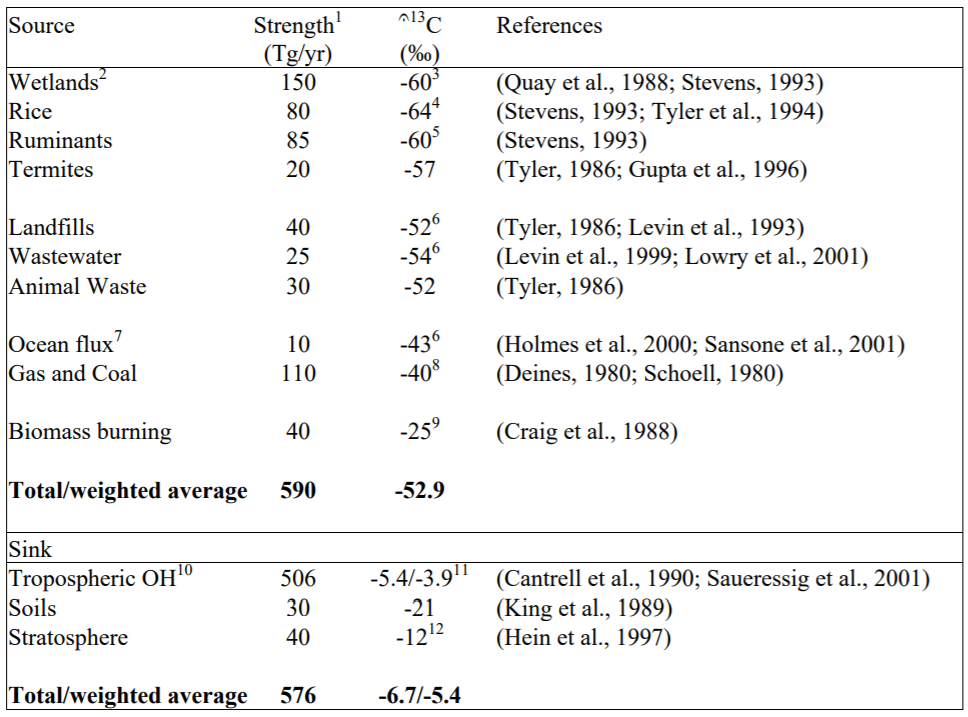
us. The isotopic 13C/12C and 2H/1H ratios indicate the strength of methane sources in the past, because different methane production processes favour
a certain isotopic ratio. The typical 13C signatures (δ13C = [(13C/12C)sample/(13C/12C)standard] − 1) × 1000) for some processes are shown in table 1.
If we track these isotopic signatures over time and combine the change in δ13C with models of, for example, the carbon cycle in this time, we can produce an estimation of the contribution of each source. However, this is not as easy as it sounds. The variability in the isotopic ratios of sources is not well defined. δ13C differs per region, and is dependent on temperature, vegetation, micro-organisms and amount of water in the ground. The uncertainties in these relationships make modelling methane emissions difficult and predicting the future of atmospheric methane is therefore still on shaky ground.


Very nice to know more about methane from biochemistry point of view :-)
ReplyDeleteThanks Jackey, glad you are finding my blog useful! If you ever have any questions feel free to contact me.
Delete